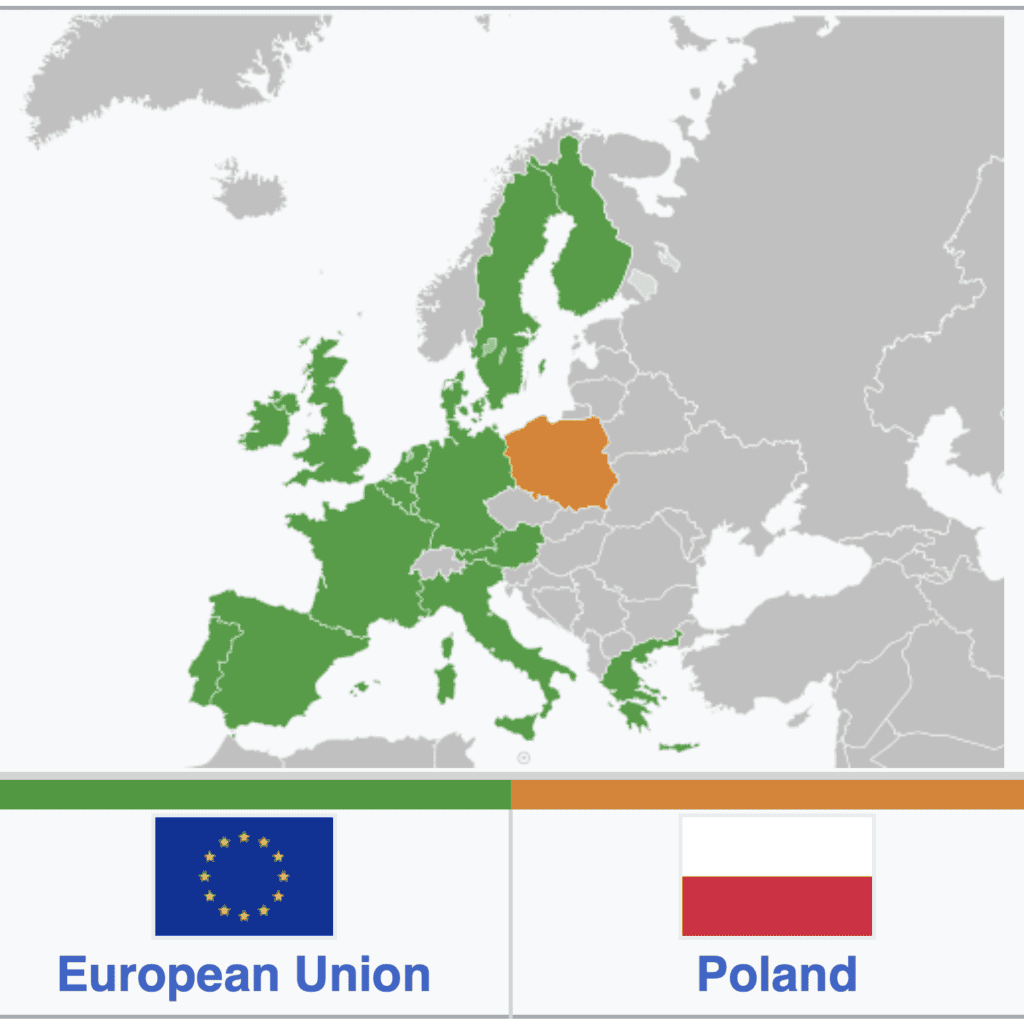
Poland is one of 27 member states of the European Union (EU). The 20th anniversary of Poland in the EU was marked on 1 May 2024. Therefore, it’S an appropriate time to go over the steps that led to Poland’s accession to the EU. I will also highlight Poland’s presence in the EU from a statistical perspective with a little help from a publication entitled “20 years together. Poland in the European Union” which was published by Statistics Poland (Główny Urząd Statystyczny).
Early relations and negotiations between Poland and the EU (1988-1997)
Even before communism fell peacefully in Poland on 4 June 1989, when the Solidarity trade union emerged victorious in partially free elections, diplomatic relations between Poland and the EEC had commenced on 16 September 1988. The following year, on 19 September 1989, an agreement on trade and commercial and economic cooperation between Poland and the EEC was signed in Warsaw.
Changes in Polish politics after 1989 certainly hastened diplomatic talks concerning Poland’s involvement in the EEC. Formal negotiations started on 22 December 1990, and ended on 16 December 1991, in the “European Agreement establishing an association between the Republic of Poland and the European Communities and their Member States”. Moreover, Poland signed a trade agreement included in the Interim Agreement that was operational from 1 March 1992.
Poland’s agreement with the EEC became effective on 1 February 1994. The first step was the establishment of the Commission for the Unification of the Republic of Poland with the EU, whose responsibility was to oversee the execution of the new agreements.
On 8 April 1994, the Polish Government made a formal request, in Athens, to become a member of the European Union. During the European Council summit held in Essen on 9-10 December 1994, EU Member States adopted a pre-accession strategy, outlining the areas and forms of cooperation recognised by the EU as necessary to accelerate integration.
The European Council Summit in Cannes in June 1995 administered an important White Paper. It was on the alignment of countries with the requirements of the internal free-market. The White Paper, together with the annual preparatory programs adopted by the Polish government, dictated the relations of Poland with the EU.
Negotiations (1997-2002)
By the end of 1997, Poland in the EU was closer to being reality than a mere pipedream. On 12-13 December 1997, the European Council met in Luxembourg to initiate accession negotiations with five countries of Central and Eastern Europe – Poland, Hungary, Czech Republic, Slovenia and Estonia, as well as Cyprus.
The EU enlargement process was officially launched at a meeting for the Council for General Affairs on 30 March 1998. It was then that Poland declared 31 December 2002 as the date it would be ready to become a member of the EU. A day later, on 31 March 1998, a study of the current laws of candidate countries compared with EU law began. Upon completion of the study, negotiations were undertaken at the same time at the request of the candidate countries. These negotiations were carried out individually with each of the candidates from 10 November 1998.
By the 2000, Poland completed talks in 25 out of 30 negotiation areas, while it was able to agree transition periods for nine of them. The remaining five areas were negotiated between 2001 and 2002.
Negotiations between Poland and the EU concluded during the EU summit in Copenhagen, on 13 December 2002.
Poland’s accession to the European Union
The Treaty of Accession hinged on approval and adoption by an absolute majority vote in the European Parliament on 9 April 2003 and unanimously by the Council of the European Union on 14 April 2003. The next stage was ratification of the treaty by all the member countries in line with their constitutional requirements. Ireland ratified the treaty through a nationwide referendum, while the other Member States adopted it by means of a parliamentary vote.
The Treaty entered into force after the EU ratification procedure. In Poland, the final process of its adoption materialised in the form of a national referendum on 7–8 June 2003.
Polish citizens answered the following question:
“Do you give permission for the Republic of Poland to enter into the European Union?”
According to results published by the National Electoral Commission in Poland, voter turnout was 58.85% (i.e. 17,586,215 out of 29,868,474 people). 77.45% voted in favour of Poland’s accession to the EU.
On 16 April 2003, the Treaty of Accession was signed in Athens. It formed the legal basis for 10 countries, including Poland, to join the European Union.
Poland became a full member of the European Union on 1 May 2004.
20 Years of Poland in the EU
20 years of Poland in the EU. It’s been a time of positive changes in society, the large-scale development of transport infrastructure and a remarkable transition in terms of employment prospects in Poland. Remarkably, the country had the highest unemployment rate in the euro-zone in 2004 (18.6%), while in December 2023, Poland had the second lowest unemployment rate in the EU (2.7%). Quite a turnaround indeed.
The EU Budget and financial flows between Poland and the EU between 2004 and 2023
The EU budget is primarily funded (70%) by contributions from member states based on their gross national income. 13% of the budget is by customs duties on imports from outside the EU. Contributions based on value added tax make up around 12% of the EU budget.
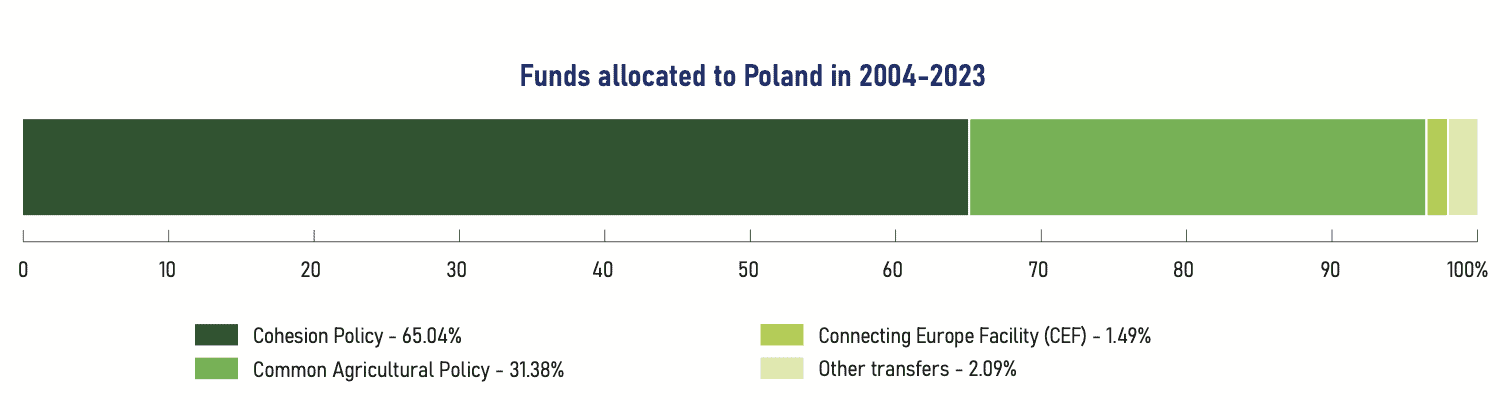
My first association with Poland in the EU is the admirable way it has put financial transfers from the EU to good use, particularly in the areas of transport infrastructure and increasing investments to support cleaner energy. Between 2004 and 2023, Poland received EUR 246 billion net from the EU budget, making the country one of the largest beneficiaries of EU funds. Poland did pay EUR 84 billion into the common budget, giving a net receipt of EUR 162 billion.
Here’s a breakdown of EU funds allocated to Poland between 2004 and 2023:
Changes in Polish Society
I’ve picked out a few revealing statistics from the report compiled by Statistics Poland – “20 Years Together: Poland in the European Union” – related to societal changes observed from the time Poland joined to the EU up to 2023. Here they are:
1. Net Migration per 1000 Population in Poland
First of all, Poland’s net migration rate has remained fairly stable over the past 20 years, compared with the average net migration rate for the 27 member states of the EU (EU 27):
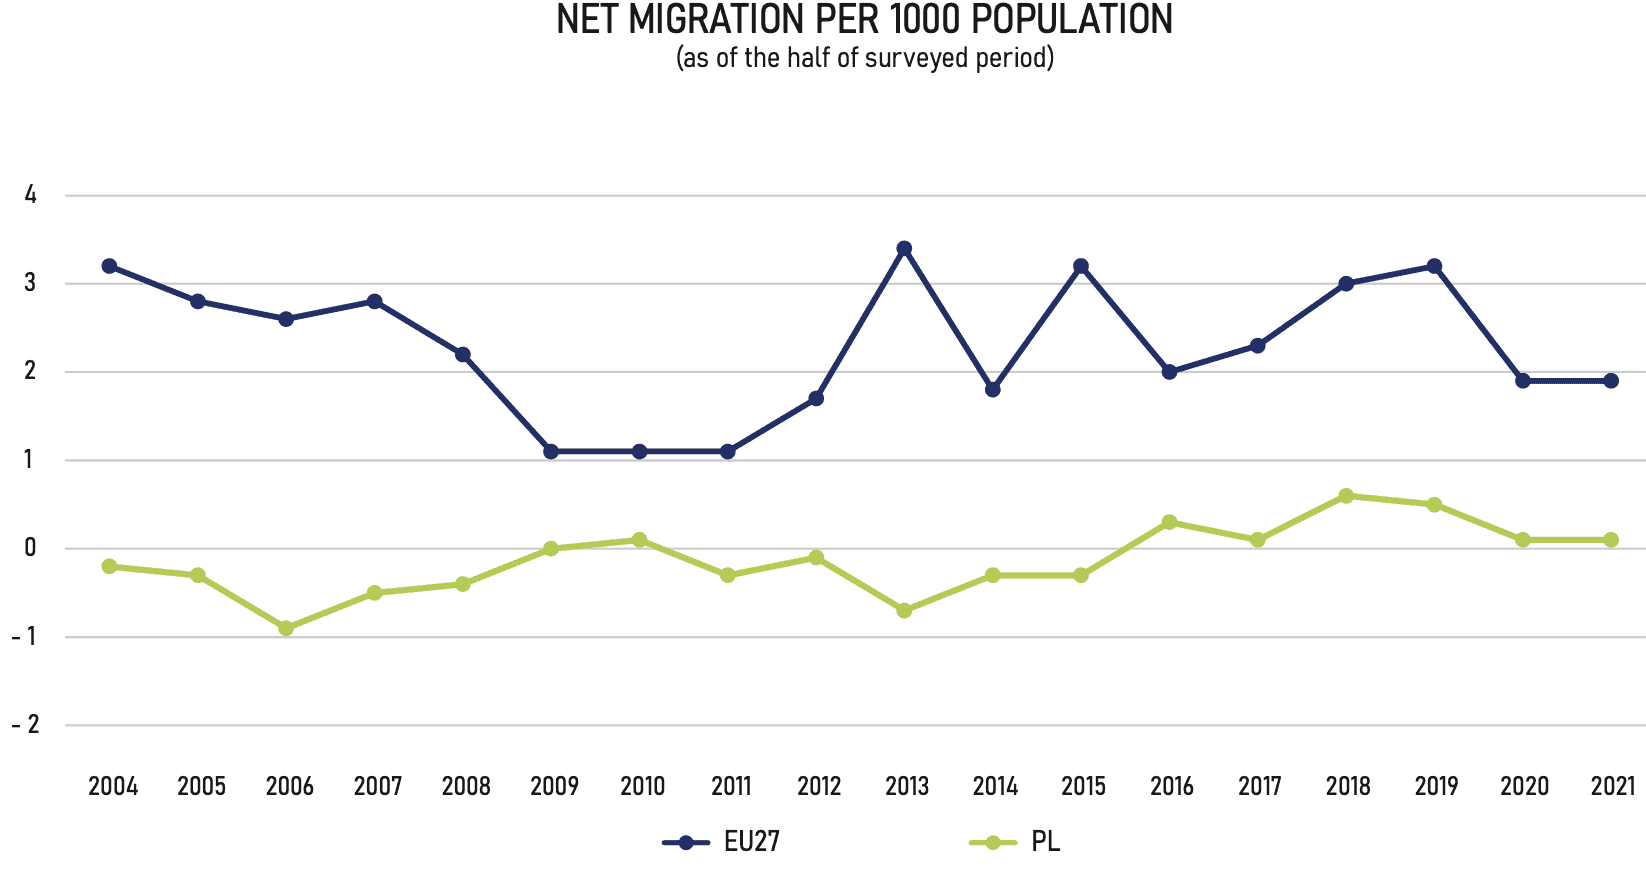
The net migration rate compares the difference between the number of persons entering and leaving a country during a particular year per 1,000 persons.
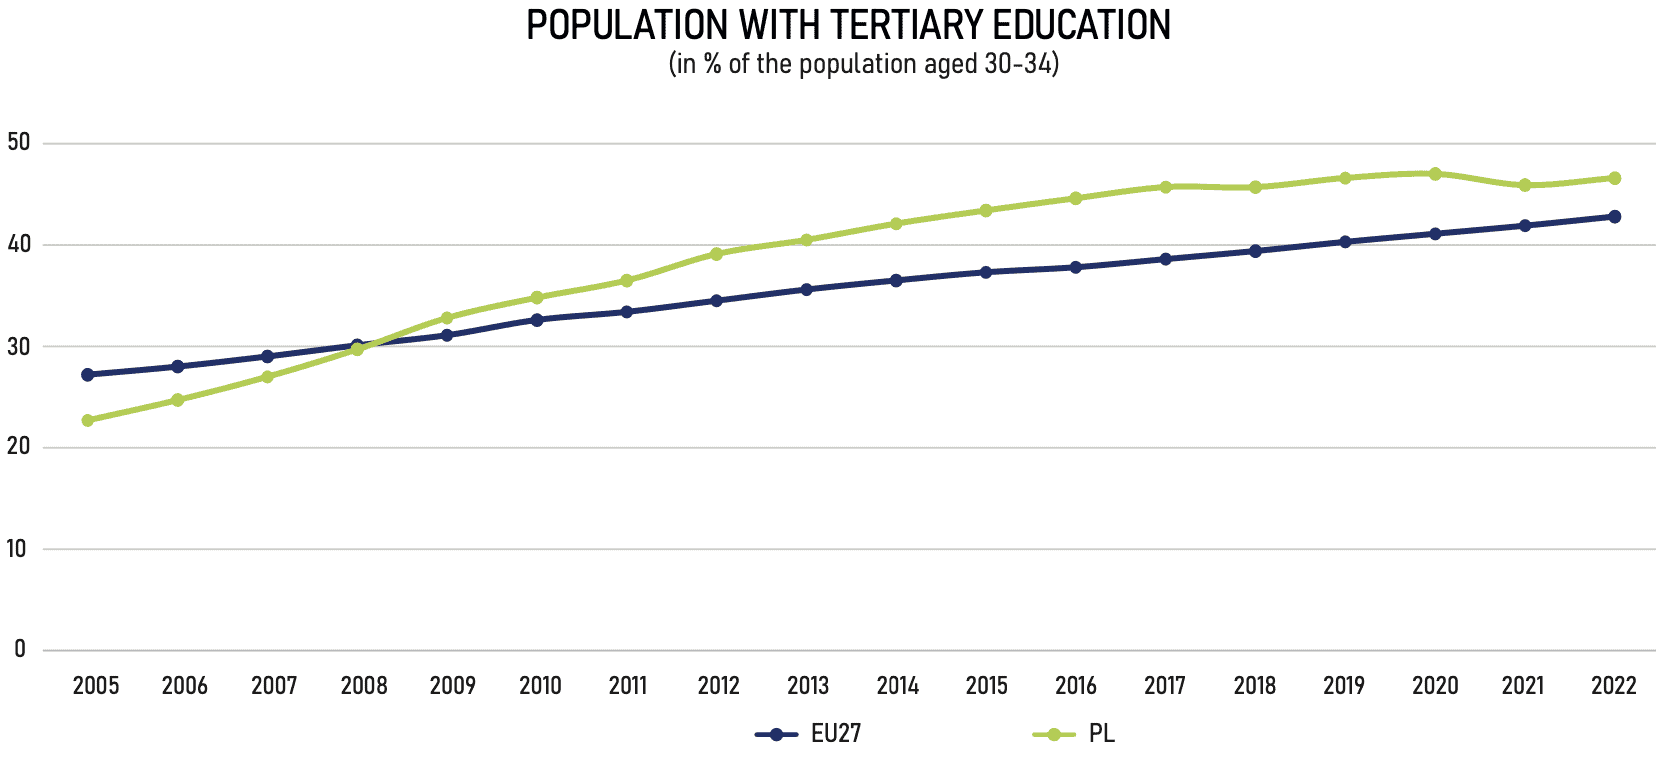
2. Population in Poland with Tertiary Education
In each year between 2013 and 2022, over 40% of the Polish population aged 30-34 had received some form of tertiary education.
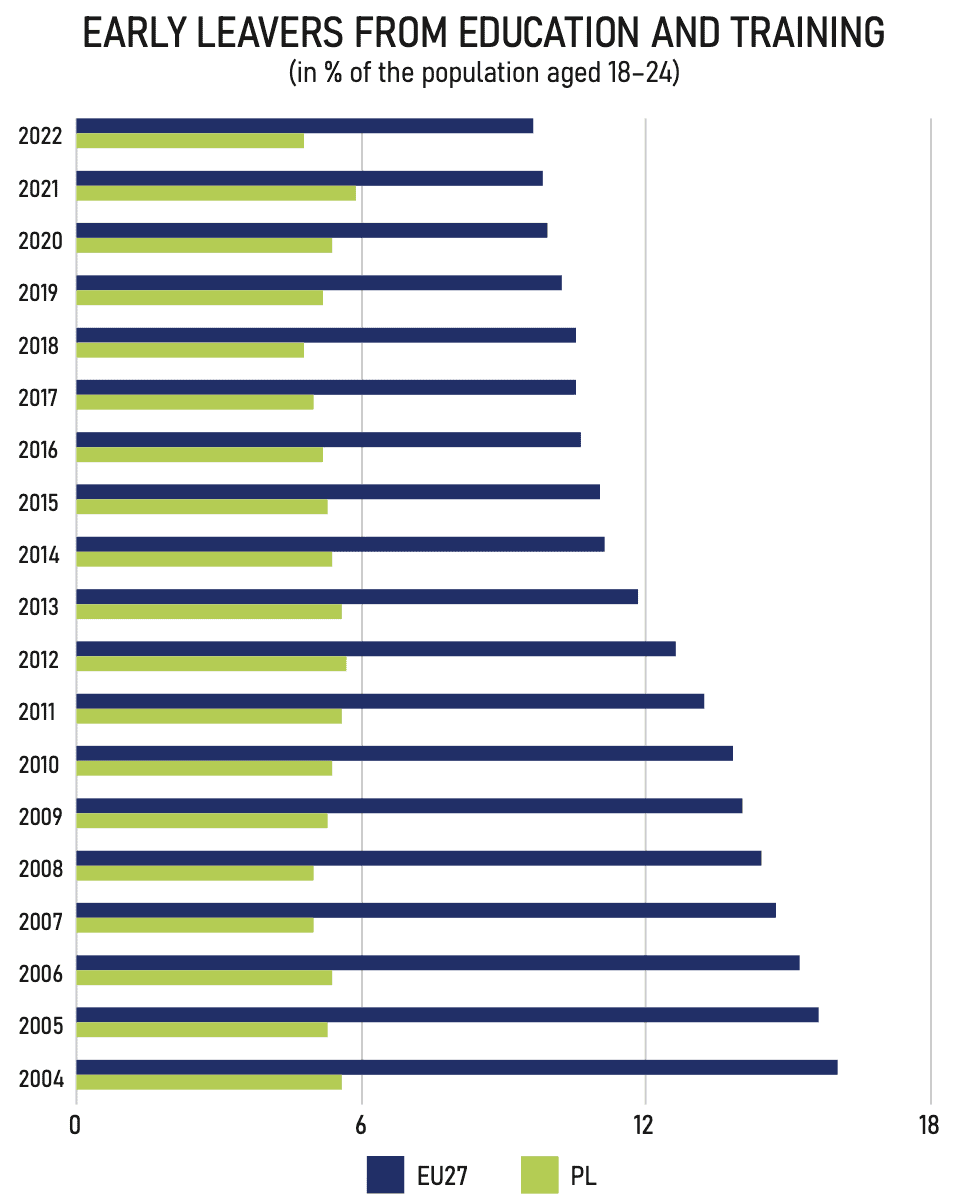
3. Early Leavers from Education and Training in Poland
As the graphic below indicates, the percentage of persons aged 18 to 24 who failed to complete their education and training courses has always been lower in Poland than in the 27 EU member states as a whole:
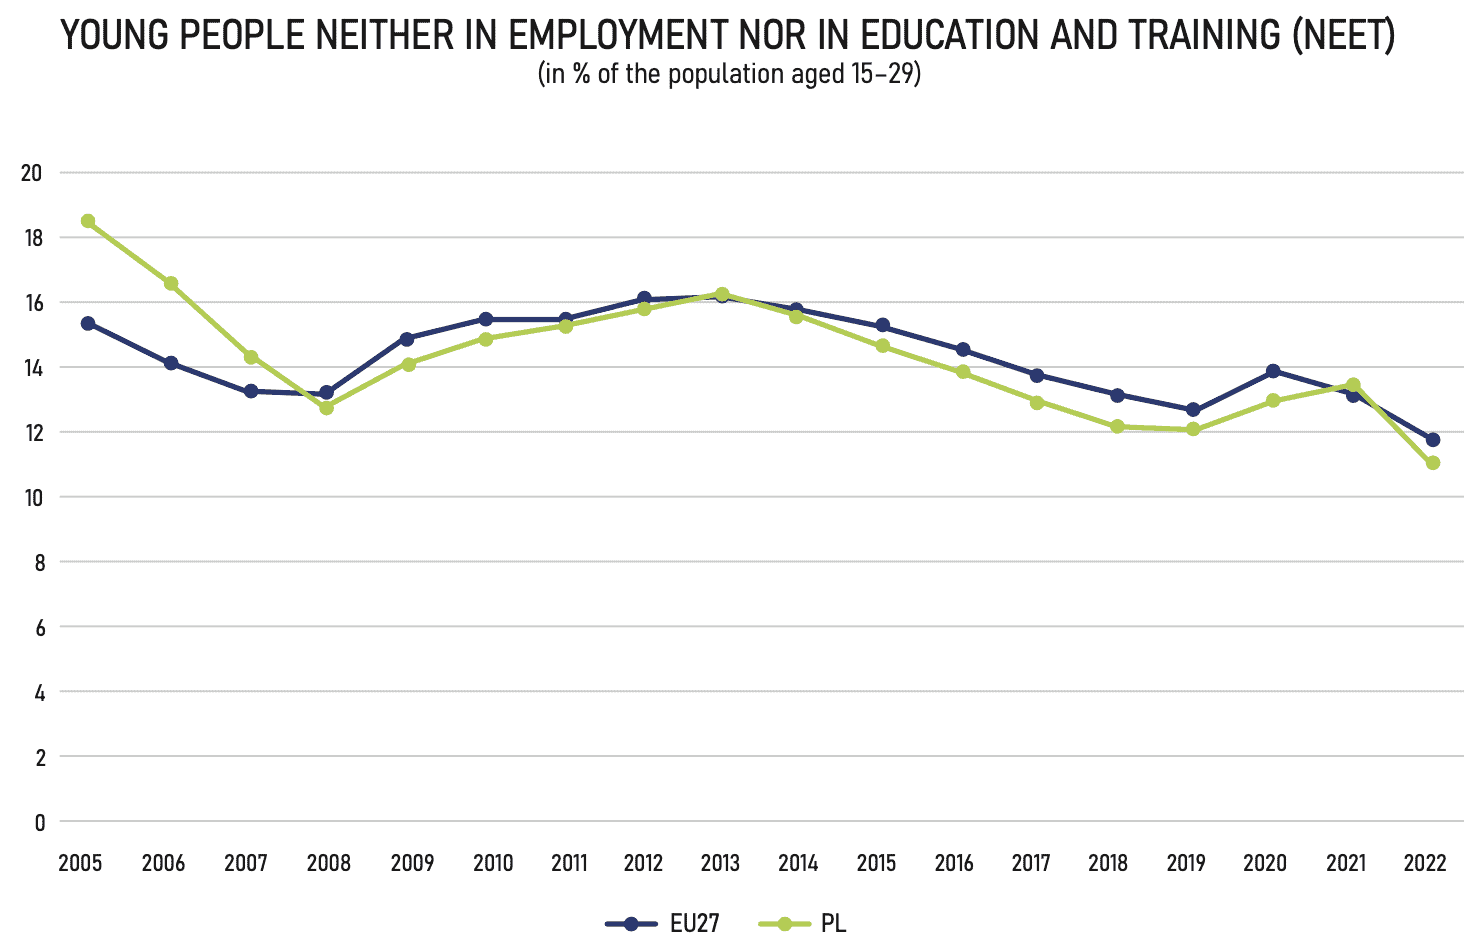
4. Young People in Poland neither in Employment nor in Education and Training (NEET)
In 2005, around 18.5% of young people in Poland were neither in employment nor in education and training. This figure was closer to 11% in 2022:
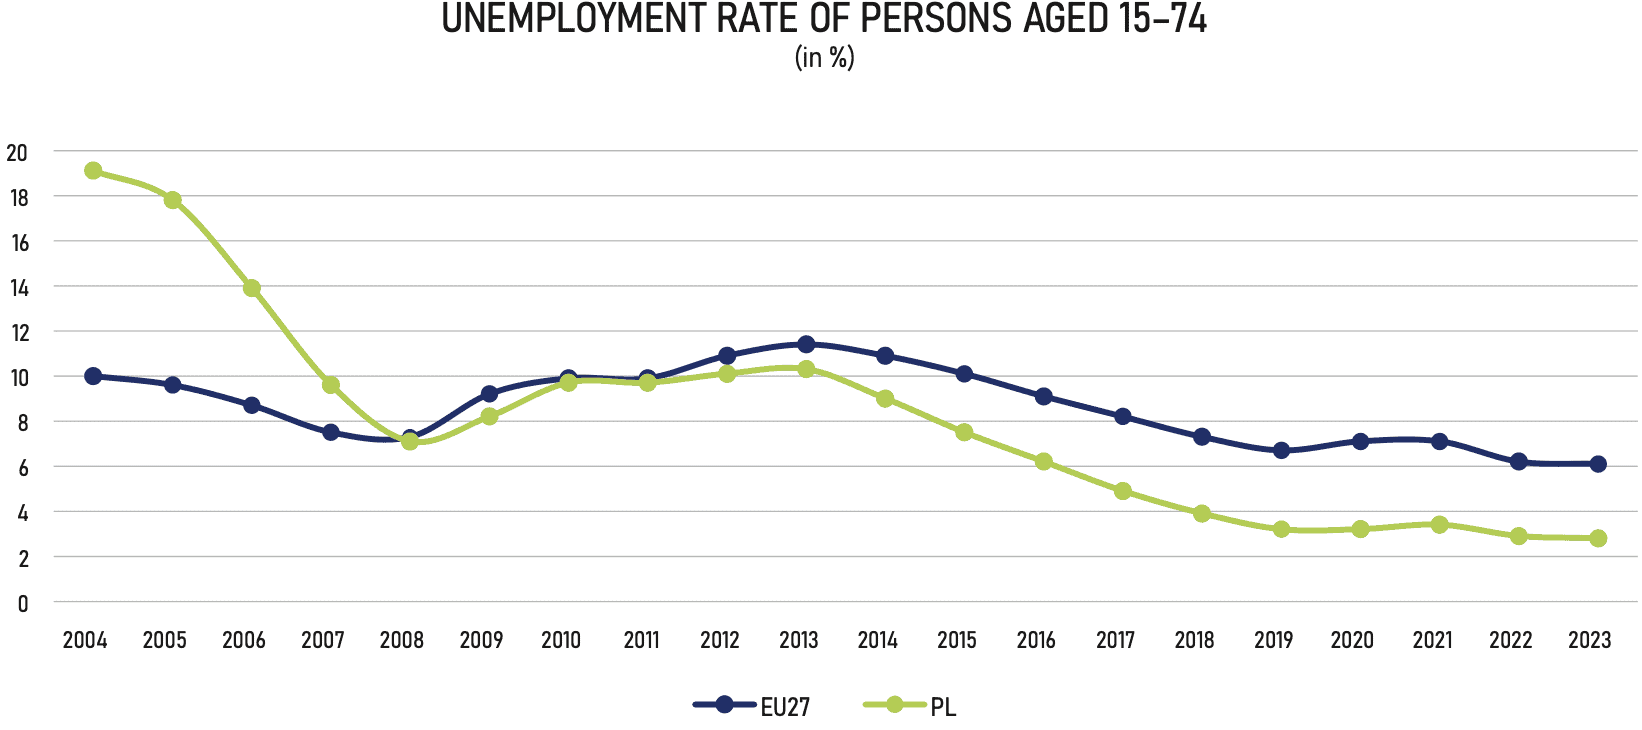
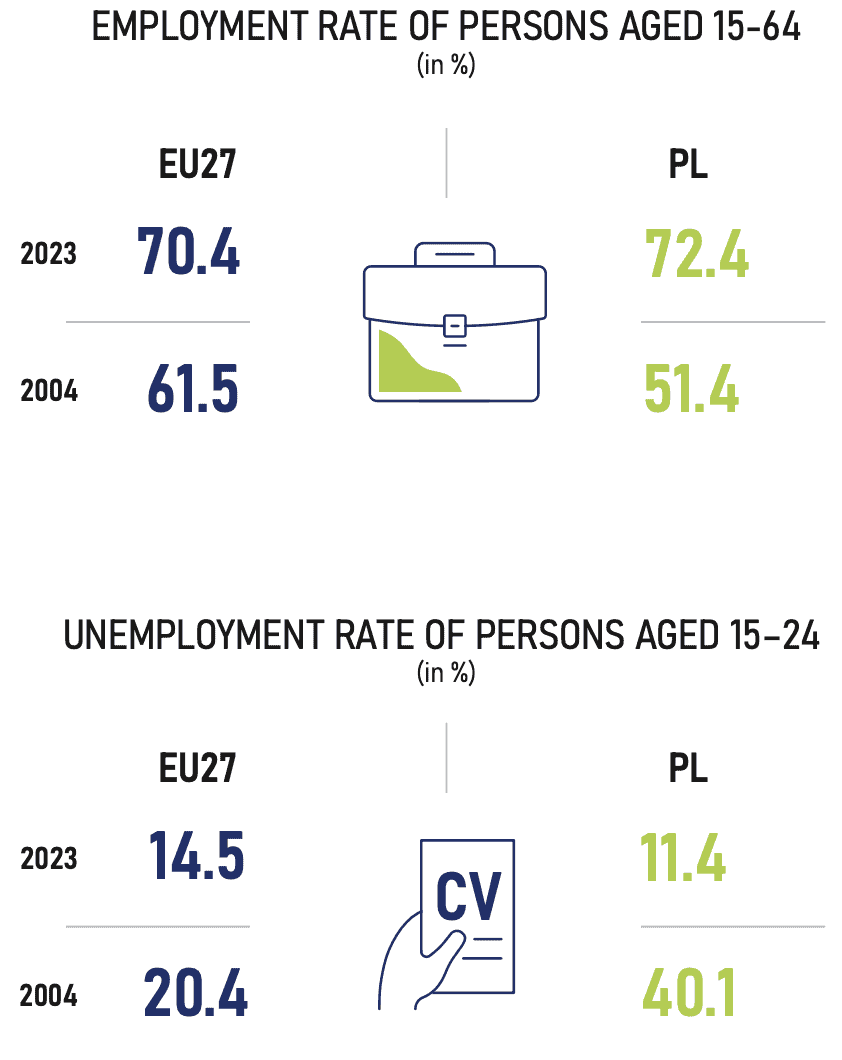
5. Employment and Unemployment Rates in Poland (2004-2023)
Undoubtedly, Poland in the EU has been a success story in terms of the unemployment rate of persons aged 15-74, in particular young persons aged 15-24:
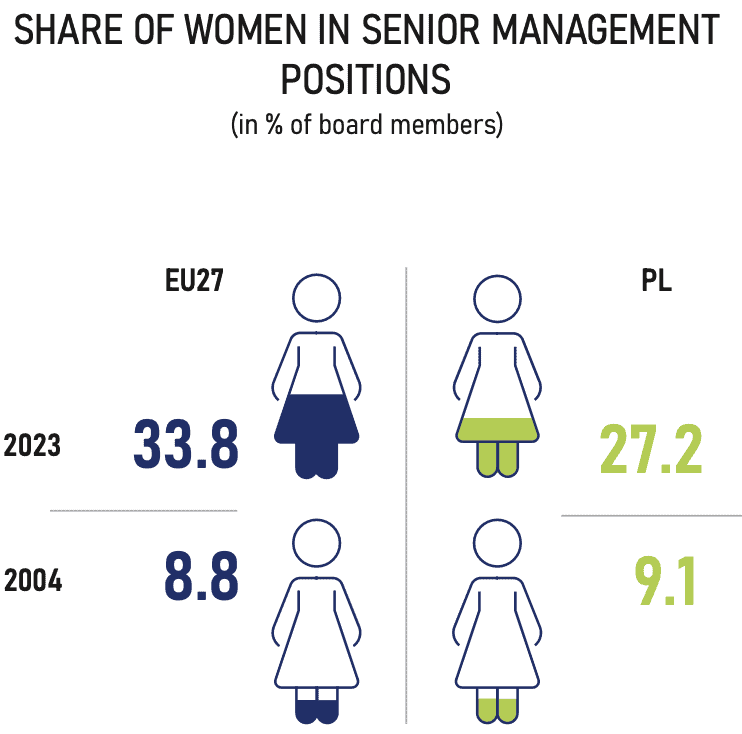
6. Women’s Advancement in the Workplace in Poland
The graphic below pertaining to the share of women in senior management positions (in % of board members) illustrates just how far women have advanced in the workplace in Poland:
The Polish Economy since 2004
Having considered some of the most major changes that have been recorded in Polish society, let us now turn our attention to how certain aspects of Poland’s economy have fared since 2004:
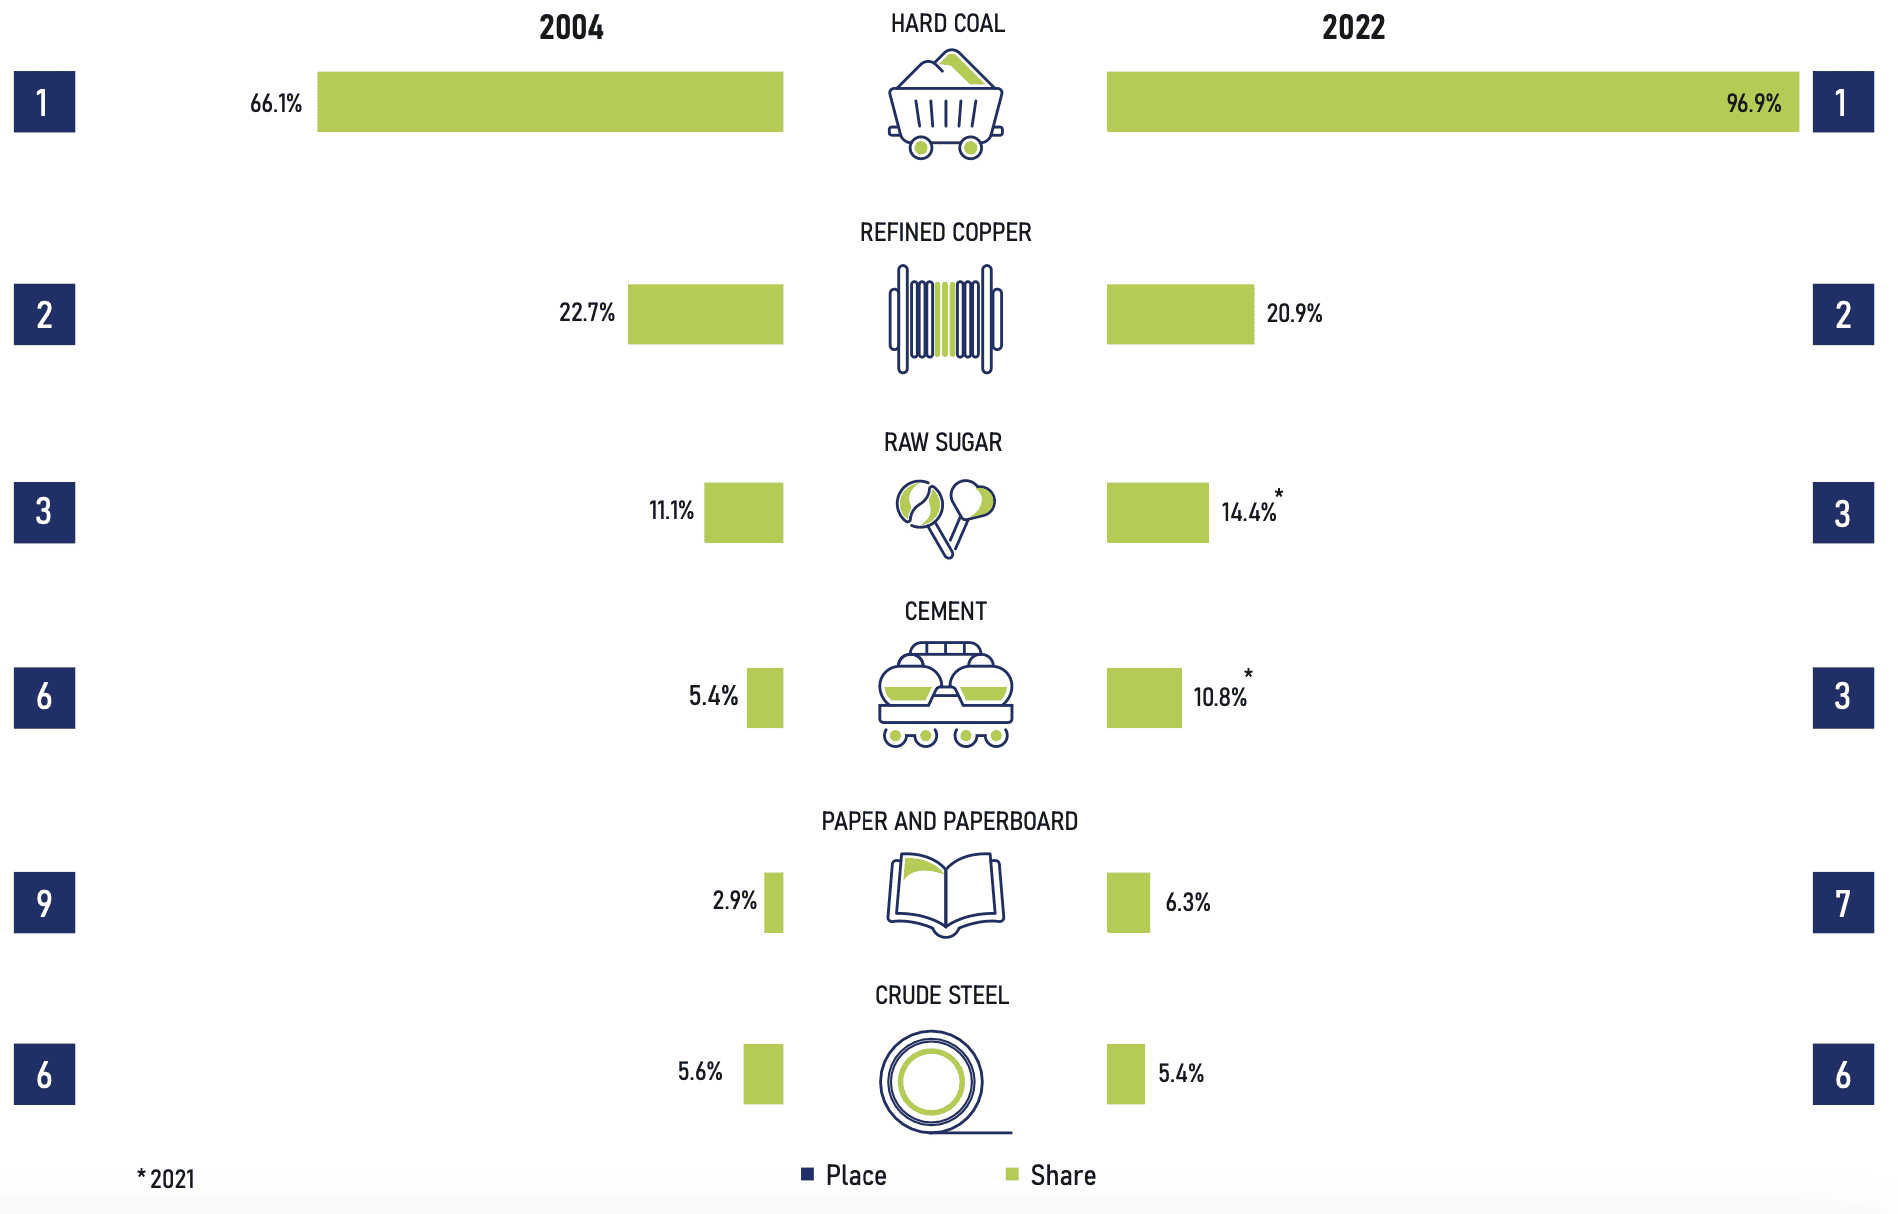
1. Production of selected industrial products: Poland’s share and place in the EU
When it comes to the production of vital industrial products, Poland’s share has increased markedly since 2004, with the exception of copper:
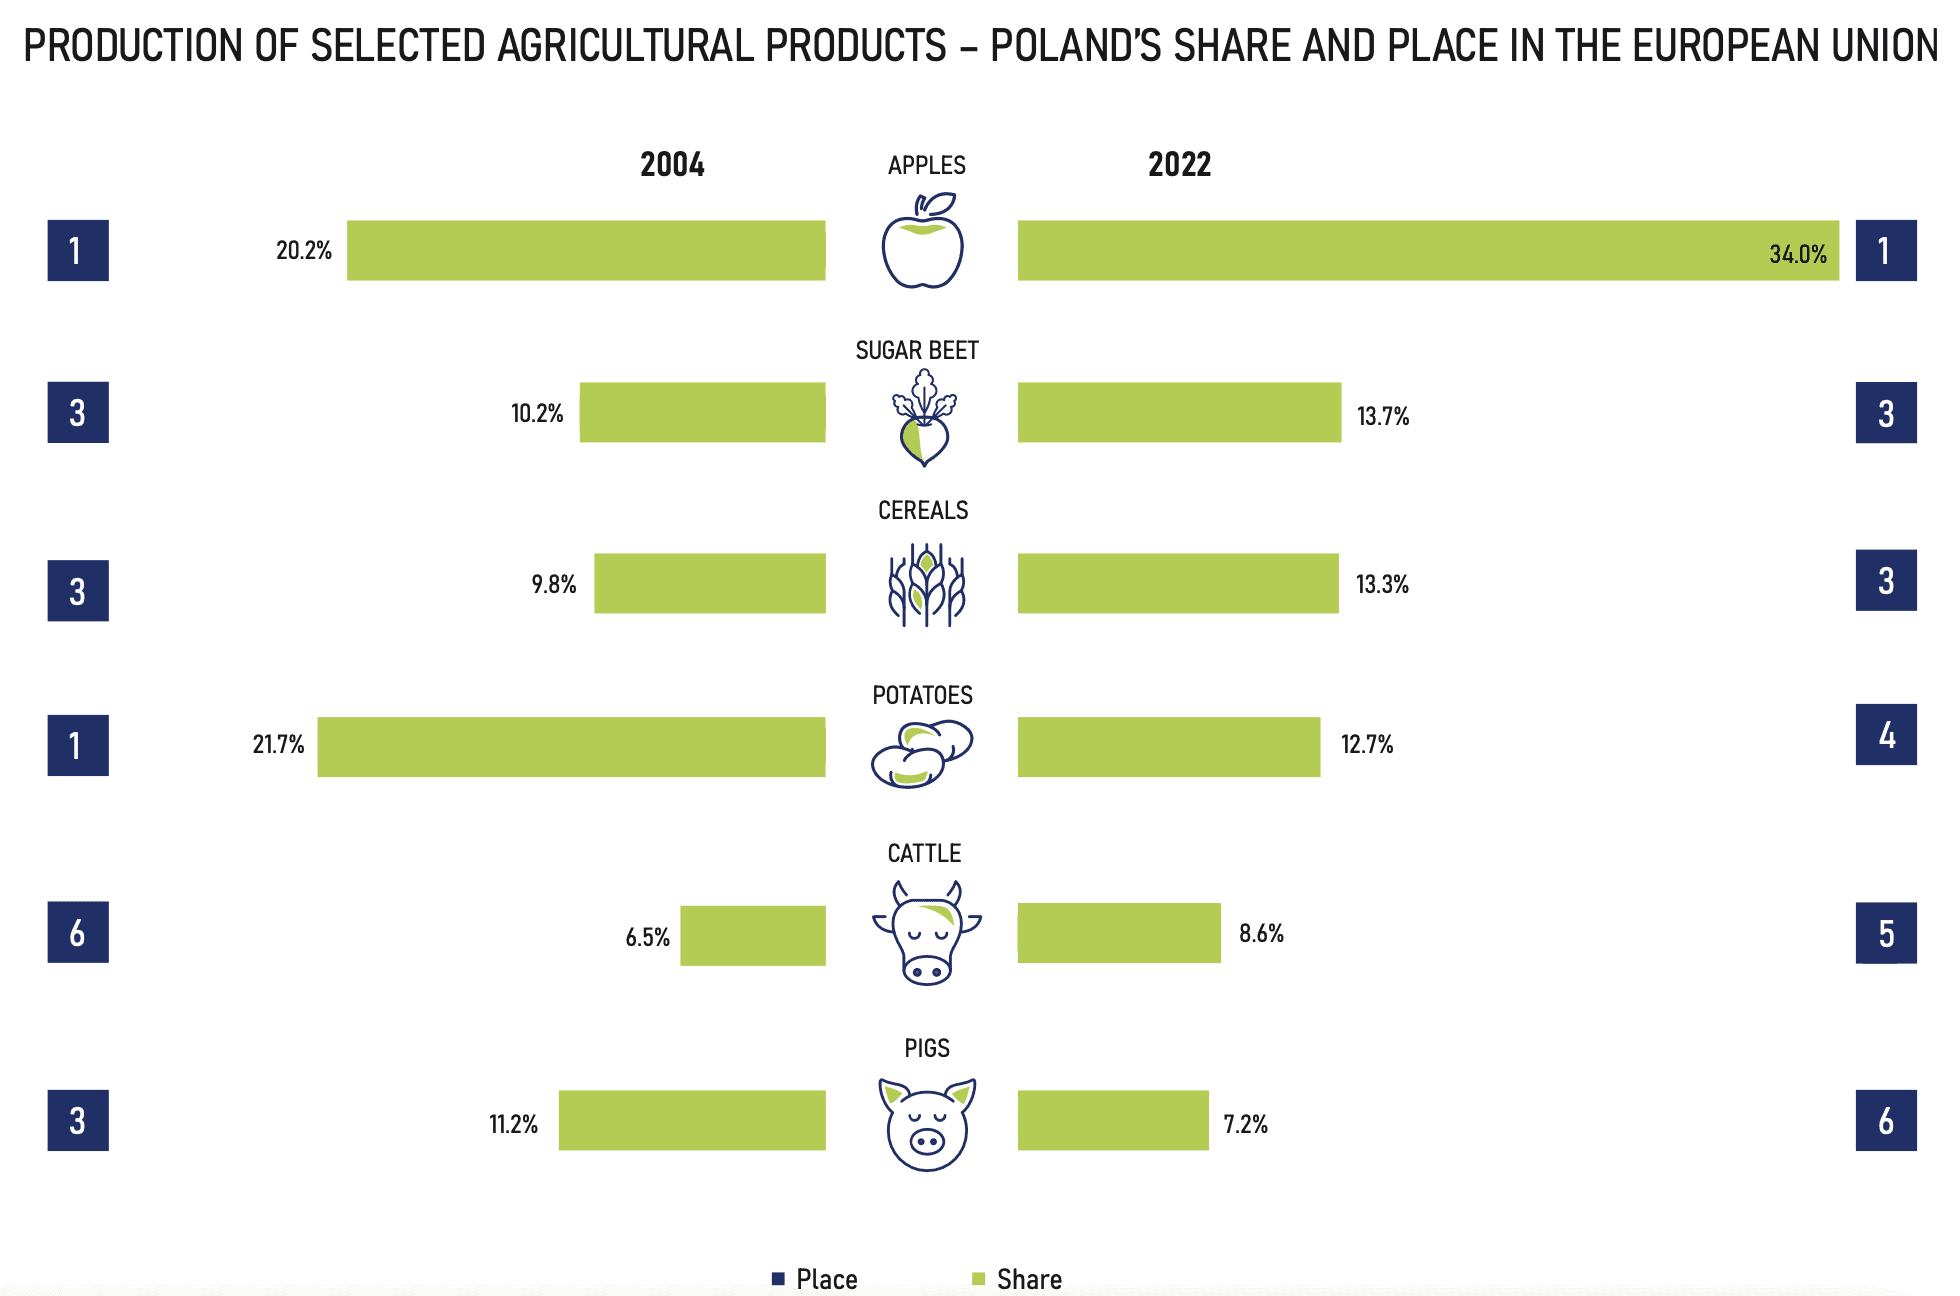
2. Production of selected agricultural products: Poland’s share and place in the EU
Poland’s share and place in the EU regarding the production of agricultural products such as apples, cereals and sugar beet has increased since 2004. However, the percentage share of the production of certain products, such as potatoes, has fallen:
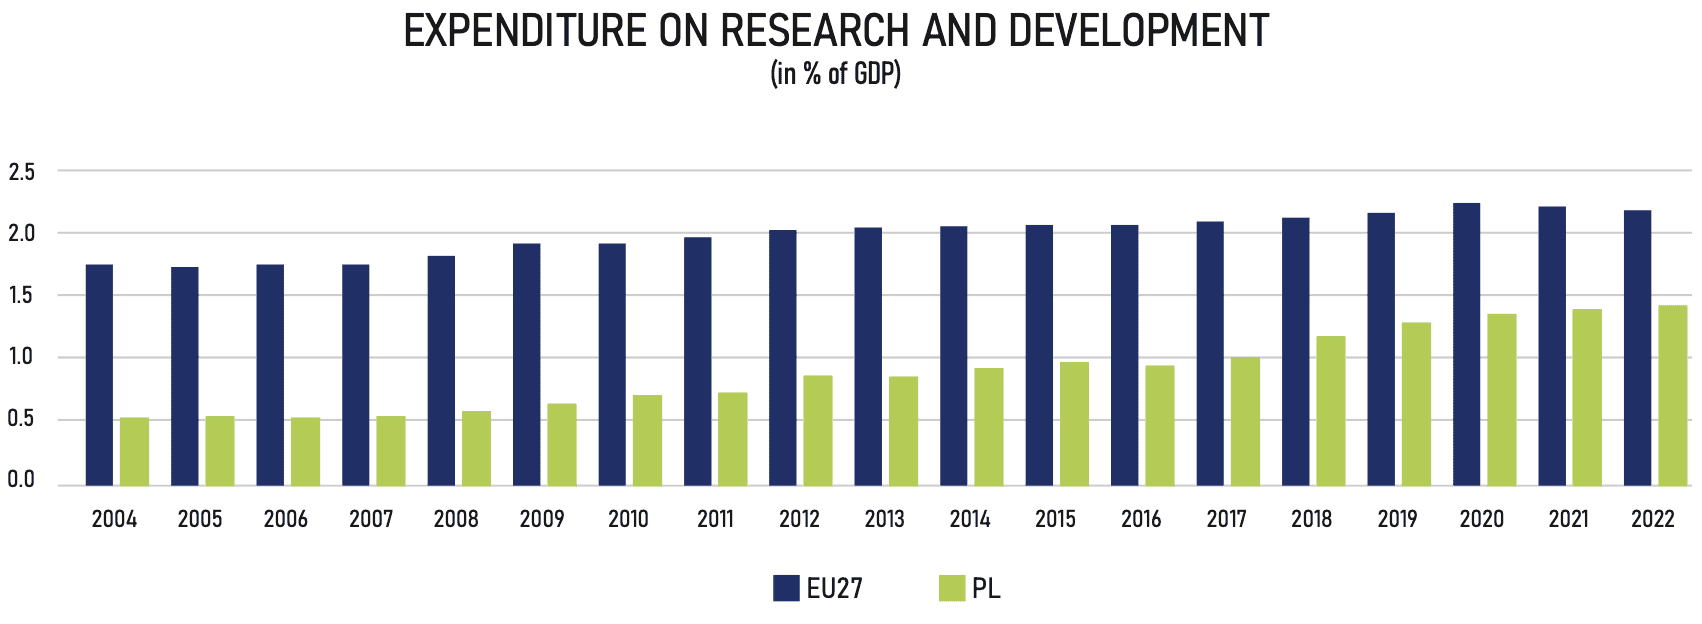
3. Poland’s expenditure on research and development (2004-2022)
Poland’s expenditure on research and development (in % of GDP) between 2004-2022 has seen steady increases:
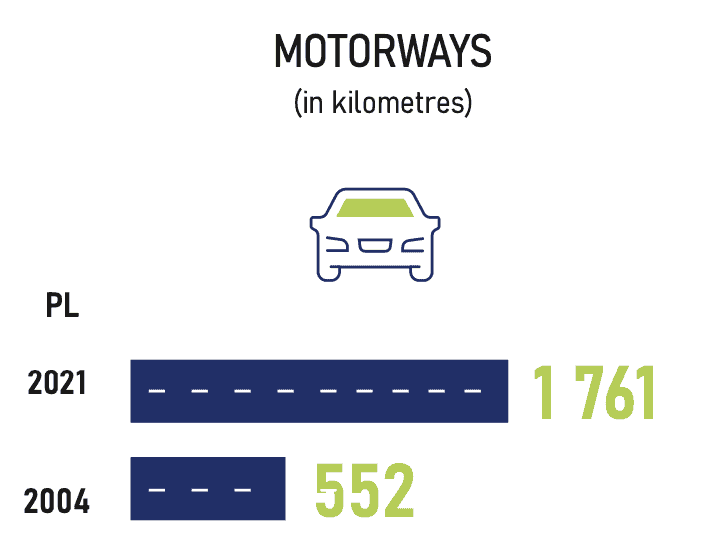
4. Length of Motorways in Poland
Poland’s road infrastructure has come on in leaps and bounds since 2004. The graphic below shows how many kilometres of motorways there are in Poland. The figure is now closer to 1,850 km:
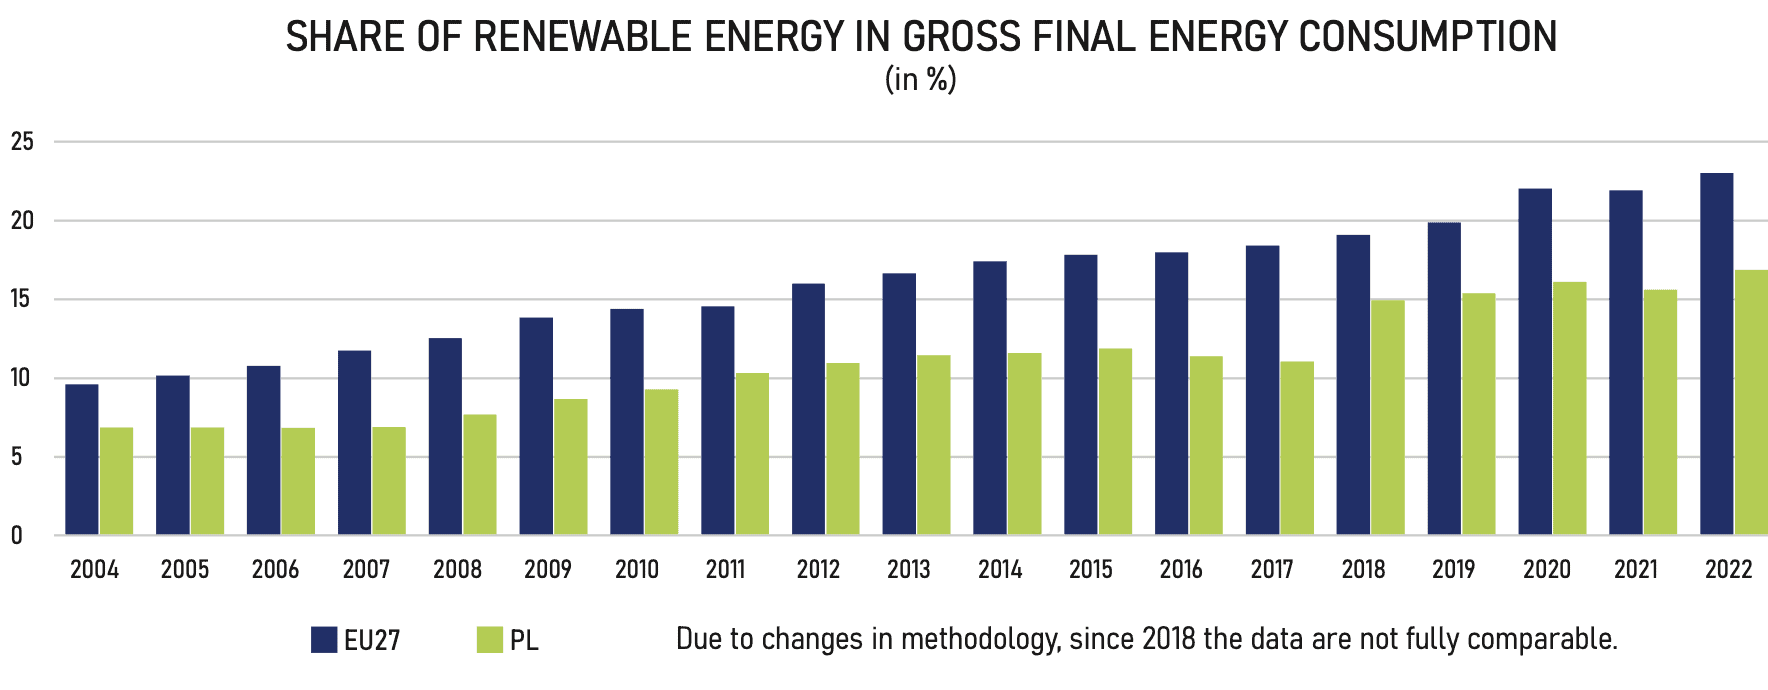
The Environment in Poland
The report “20 Years Together: Poland in the European Union” contains a great deal of data pertaining to the environment, in particular greenhouse gas emissions, emissions from motor vehicles and the structure of energy consumption in households by type of use. I’d like to share one graphic which shows the percentage share of renewable energy in gross final energy consumption from 2004 to 2022. The trends are positive for both Poland and EU 27:
Poland in the EU
Poland in the EU has undoubtedly been a success story, particularly in the areas of employment, industrial and agricultural production, and traffic infrastructure.
However, the report “20 Years Together: Poland in the European Union” doesn’t necessarily paint a rosy picture of Poland’s development in certain areas since 2004. For instance, when it comes to the environment, net greenhouse gas emissions in 2022 were at similar levels to what they were in 2004. In terms of agriculture, a disappointing takeaway would have to be the fall in the percentage of total agricultural land in Poland that’s under organic farming (from 4.5% in 2012 to 3.5% in 2020.
Some areas of the report related to Polish society should be taken with a pinch of salt. For example, the percentage of households in Poland which declared that they “make ends meet” is extremely subjective. Apparently, 51.5% of households had either “great difficulty” or “difficulty” making ends meet in 2005. The percentage was 15.3% in 2022.
Finally, the average cost of living in Poland has shot up dramatically in recent years. Therefore, much of the data which only goes up to 2022 or 2023 may not be representative of the current reality. For instance, the at-risk-of-poverty rate had apparently fallen between 2019 and 2022. However, would the figure have dropped again between 2022 and 2023?
Reference:
Statistics Poland. (2024) ‘20 Years Together: Poland in the European Union’ Available at: https://stat.gov.pl/en/topics/other-studies/other-aggregated-studies/20-years-together-poland-in-the-european-union,37,1.html (Accessed 8 June 2024).